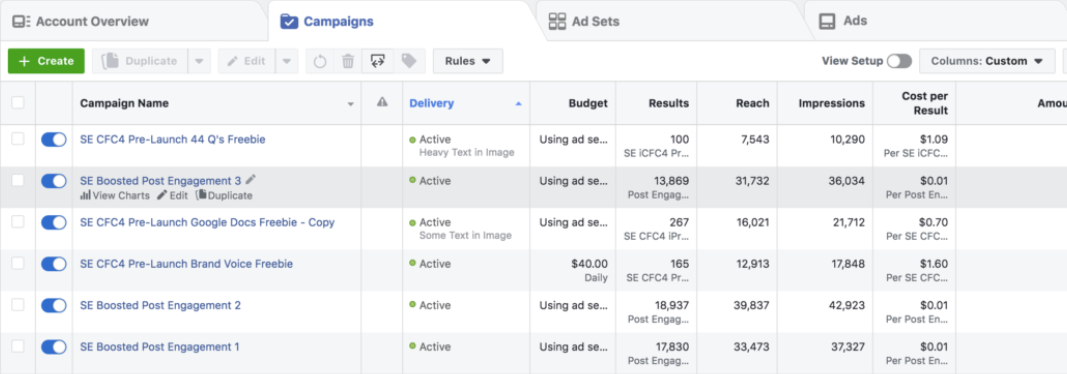
The key to a successful Facebook Ad campaign starts with tracking and analyzing results. The data in the Facebook Ad Manager lets you know what’s performing well and what isn’t. The information can be used to adjust ads and track the results of those adjustments. It also gives you ad-specific data to improve your overall Facebook marketing strategies.
Facebook ad metrics are pieces of data that convey the success of your ad campaigns based on the intention of the ad. Some of the key elements of a successful ad campaign are:
- Desired Action – Is the ad doing whatever it is you’re asking it to do (get clicks, garner engagement, get conversions, etc.)?
- Cost – Are costs acceptable?
- Building your Brand – Is advertising overall helping to build your brand and engagement in a positive way?
There are many factors that determine ad campaign success but answers to these three questions are an excellent place to begin.
Perhaps you’re already familiar with your Facebook analytics in Ads Manager and you regularly track how your campaigns are doing. For some, the data in there can be overwhelming, particularly if you aren’t a marketer or you’re just getting started with ads. Let’s get you started and stick with it! I promise it will be worth it.
I’m going to break down some of the steps so you can use the data to improve your results. We’ll walk through the process of analyzing your Facebook ad performance using the analytics dashboard and a few important metrics. Let’s zero in on some key ad metrics in your Facebook Ads Manager that tell you how your campaign is doing.
HOW TO FIND YOUR DATA
If you’re just starting out, you’ll need to know how to get to your Facebook Ads Manager, which houses all the data:
- Sign into Facebook.
- Click the arrow at the top right of the screen and then click Manage Ads (you can also click here – you must be logged in to Facebook).
- Click on your ad account.
- From here, you’ll see your current and previous campaigns and can click on any of them for more detailed information.

This area is what we’ll be using to find key metrics to analyze including link clicks, ad frequency, cost per action, and return on investment.
CLICKS
Clicks are one of the most straightforward forms of ad data and the most important Facebook ad metrics, even when not the main objective of your ad. How many times a click on your ad occurs is the most basic way to know that your ad prompted an action. The click confirms that action. I’m sure you’ve clicked on ads on Facebook. Here’s what happens next.
LINK CLICKS
When you click on an ad it takes you to a landing page where you are asked to take another action. It’s there that you’ll either take another prompted action – like sign up for an offer or make a purchase or register for something – because you’re interested in what you see. Or, you’ll click away and go back to what you were doing because the offer didn’t interest you enough, even though the original ad did.
Your ad link clicks can show you if your ad is interesting enough to make people click, which is critical for you to know. If your audience is not clicking over to the landing page, they never consume the message on that page. They won’t be signing up for an offer, making a purchase, or registering, etc. Link clicks tell you if the ad is effective enough to get them to go to the landing page in the first place.
CONVERSIONS
If they click over to your landing page but then don’t sign up, buy, register, etc., this tells you it may be the landing page (and not the ad itself) that needs adjusting. Link clicks with minimal conversions (purchases, sign-ups, etc.), reveal that something isn’t working with your landing page or offer itself, and the ad is not the likely issue.
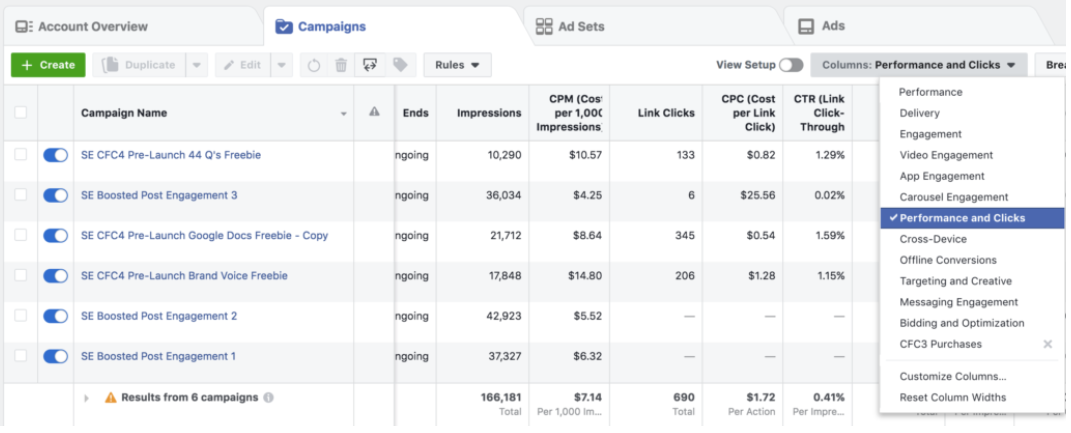
Find your link clicks in Ads Manager. If you’ve chosen Traffic as your main objective when you created your campaign, clicks will automatically show. Alternatively, you can click on Columns (see screenshot below) and select “Performance and Clicks.” And if you REALLY want to see what’s what, click on Breakdown (right next to the Columns ) -> By Action -> Destination, to see the breakdown of where people clicked from your ad, like your page’s name or the URL associated with your ad (which will most likely be your landing page).

AD FREQUENCY
The frequency metric, ad frequency, shows how many times Facebook shows your ad to each person who sees it. Think about some of the ads you see on Facebook. You might see some only once or twice, while others come across your feed a few times a day.
Those that you see frequently might start to annoy you after a while. They might even cause you to click on the “Stop showing me this” option that Facebook offers.
Use your frequency score to improve your results. Retarget the Facebook audience that sees your ad to include new people instead of the same pool of Facebook users. Here’s more information on Facebook targeting and retargeting to help you out!
Find the frequency by clicking on Columns: Performance and Clicks. You want that number as low as possible. For my clients’ campaigns, I start itching when it’s above 3 views per person. There are some exceptions. However, higher frequencies run the risk of irritating people, so keep that in mind.
COST PER ACTION AND RETURN ON INVESTMENT
These two go hand-in-hand. They’re both related to how much you spend, obviously a crucial part of the ad process. Cost Per Action (CPA) refers to how much you spend per targeted action. For instance, it’s how much it costs you for someone to sign up for something or make a purchase. Return on Investment (ROI) is how much you make versus how much you spend. In Facebook Ads world, it’s called ROAS, or Return on Ad Spend.
Your CPA helps you know how well your ads, your landing pages, your targeting and your offer are working together in terms of getting prospects from your ad to your chosen action.
Your ROAS depends on the type of conversions you’re looking for because sign-ups will obviously not bring you money immediately like a purchase will. But, if you’re getting hundreds of sign-ups from people who will become potential customers from spending $100 on one ad campaign, then that’s a pretty good return, amiright?
PUTTING THE METRICS TO WORK
At face value, Facebook Ad metrics provide valuable data about the results of our ad campaigns. Their true potential is found when we take action after analyzing them.
Get familiar with the data for your ads by using the steps we’ve explored. Then adjust your current and future ads based on what you learn. This is the best way to use Facebook Ads to market your business over the long haul. Metrics help you fine-tune your Facebook Ads marketing strategy.
These steps offer an introduction to Facebook ad metrics and their value to an overall Facebook Ads marketing strategy. Using the data to improve your results over time is how you can really have an impact. Anything here shed some light on data to help your ad campaigns? I’d love to know.


0 Comments