")
The Facebook ad world is a big one, absolutely packed with random terms and tons of numbers to remember on any given day.
And, if you’re not actually a FB ad expert (which, hey! Most people aren’t!), it can be reaaaaally tricky to know which of those terms and numbers are, like, actually important to pay attention to.
See, every piece of Facebook ad data does matter in the long run, but there are really just a few we recommend our entrepreneurs pay attention to: budgets/frequencies, clicks, and good ole’ pixel events.
And, if you read that like “whaaat?!” don’t you worry — we’ve got you.
First things first — personalize your Ads Manager dashboard.
When you take a look inside your Ads Manager dashboard, you’re going to see a ton of categories that you might not understand. The key? To personalize it so you see the good stuff!
If you visit your dashboard, you’ll see a little drop-down arrow next to the words “Column: Performance.” Click it, and select “Personalize Columns.” Now, you can personalize exactly what you see.
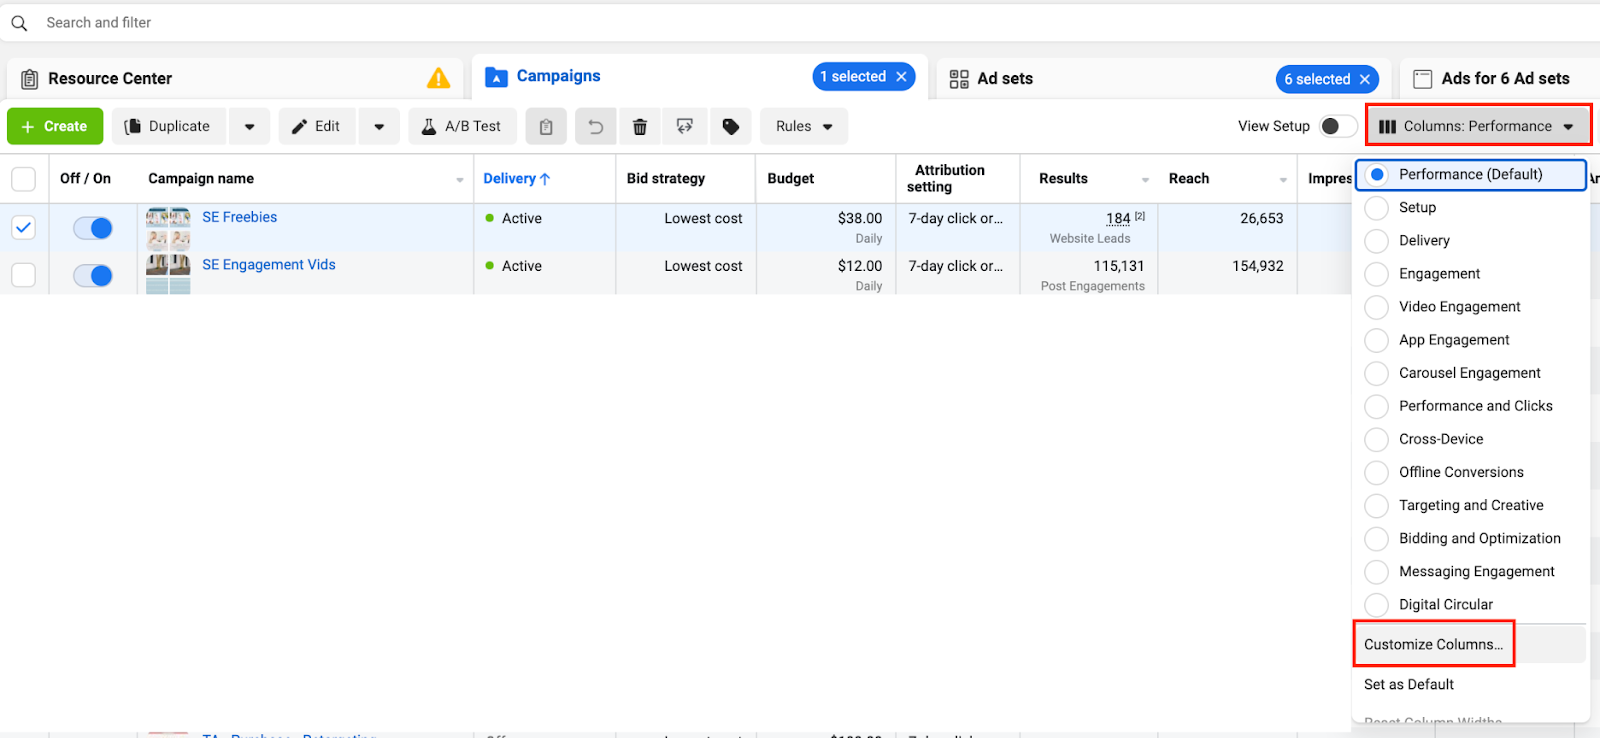
Select the metrics you actually want to see, and drag and drop them in the order you want! This almost immediately takes away an absolute ton of confusion for you, since you’ll be able to only see the things you already understand on a high level. Win, win. And feel free to use the pre-set options that you see in the image column above. If I’m looking at something quickly, I like the Performance and Clicks option.
Still confused as to which ones you should highlight? Keep on readin’!
What Facebook Ad Metrics *Actually* Matter
While you build out your custom dashboard and start implementing a great ad strategy, there are a few things that are more important to pay attention to than anything else.
A big part of a great Facebook ad strategy comes down to the very high-level basics: i.e., the ones you need to be knowledgeable about, no matter what. I recommend keeping this super general, too: costs and results.
So, bookmark this + keep coming back to it!
Results: Depending on your goal (leads, sales, engagement, etc), the Results column will be your best friend. If you aren’t seeing results, you can start diving deeper into why (see this blog post for how to diagnose this.) Your result will be whatever you chose for your objective when you set up the campaign. So, if it’s leads you’re going for, your result will be the number of leads. If it’s purchases, the number of purchases will show in that column. I’m sure you can see why this is my top metric as my clients are looking for results! And again, if you aren’t seeing results, try to diagnose why.

Costs: When you’re running an ad strategy, you’re obviously spending money in hopes for a desired result… which is why you absolutely must keep an eye on the amount you’re spending.
The Cost per Result column is where you’ll find the cost per action. So, again, if you’ve set up your campaign to get leads, you’re “cost per result” will really be your cost per lead. Once you run ads for some time, you can begin to predict what a great cost per lead is. And it will depend a lot on what your offer is, what industry you’re in, and who your audience is. I like to tell this story about a client I had many years ago. He was a diamond broker. We marketed his ads to diamond buyers. It was a hard sell. Our cost per result was gigantic but when we secured just one result (1 lead), it sure paid off. Tens of thousands of dollars. So, obviously his cost per lead/result would be much, MUCH higher than my current clients who are selling digital courses and offering freebies, right? So, our costs per lead are typically between the $1 – $8 range, depending on the audience).
So, pay attention to your cost per result and test different creative, copy, audience and offers to see if you can get that cost down.
Bonus: other metrics: Ok, so we’ve got the basics above. Now, when you’re ready, there are a few other metrics I like to look at. Cost per impression is always interesting to me. This is what it is costing you to “impress upon” 1000 people. During the holidays I was seeing this number up to the $80 range, which, for our audiences, was outrageous. And it allows me to think about strategy. Do I want to try other, less expensive audiences? Or is the return on ad spend still fruitful enough to keep going? Or do we want to focus on engagement ads (which are inexpensive) until after the holiday? So, cost per impression can be insightful. Frequency is also a number I like to pay attention to. Frequency is the number of times any ONE person has been shown your ad. I personally like to keep this number at 3 or below, however, during a launch, when we’re pushing people for just a few days toward a sale, that number might be higher. And I’ve heard other advertisers say that they let it reach 6 or even 8. It’s a personal preference but the further that number climbs, it’s an indicator to me that people are being bombarded again and again and we likely need to widen our audience.
—
And, there you have it: the Facebook ad metrics that really and truly matter! Stop stressing about everything else, ok?! In a nutshell, start high level and as you become more comfortable, you can start digging deeper!


0 Comments